
Project 3: VR Resilience Planner
Squad: Games & Play

Introduction
Heat waves are becoming more and more prevailing. To combat the effects of heatwaves, there are a range of possibilities to apply in a city. In this research project, we (Arjo Nagelhout, Zander van den Elzen & me) explore how motivation for climate resilience in urban areas can be be improved with the use of design for behavior change and VR.
Research introduction
Something is changing in our weather and climate. Over the last years, record-breaking amounts and intense heat waves have been registered around the globe. This has resulted in wildfires on dif-ferent locations such as California, Turkey and Australia in the last 10 years. In combination with an expanding population and urbanization, an increase in extreme weather events was found during the start of the 20th century by analyzing observational databases over several areas of the Mediterranean region [1]. This is part of the multiple models on climate change which predict an increasing frequency, duration and intensity of heat waves. In 2017, the intensity and frequency of such extreme heat events had already became between two and 10 times as likely for countries in Europe [17].
This is all part of Climate-science research, a new field which emerged in the 2000s where humans’ contribution to extreme weather events is explored.
Heat waves are placed within the category of extreme weather events as they have high values of important meteorological values, but also in high-impact category as they can be seen as severe when their duration is for a longer period of time. To adapt to extreme heat is important for urban environments as the houses, buildings and other infrastructure of cities cause the temperature to be higher and stay present longer than in rural areas. This is referred to as the urban heat island (UHI). At the same time, the urbanization rate, the projected size of a population living in urban areas, is predicted to lay around 68% by 2050 [13]. At the same time, the worlds population in 2050 is predicted to reach approximately 9.8 billion according to the United Nations. This is 30% more than the current 7.6 billion. Heat can form a serious problem for citizens and cities as it results in more harm and deaths, less worker productivity and hurts economies [26].
To adapt current living environments to these extreme heats and other changes of climate is important. The solution for this lies, partly, in climate resilience, which is aimed to reduce the aforementioned vulnerabilities. Governments are targeting to implement more climate resilience in these urban areas. However, a significant percentage of urban environments are privately owned such as buildings, rooftops or gardens. That is why the motivation of privates to implement climate resilience in their environment is of great importance, next to the input of governments.
In addition, Virtual Reality (VR) has gained educational interest as it can contribute to research and change in attitude and behavior [21]. The communication of information is crucial in design for behavior change. Visualizations and immersive experiences show great potential to contribute in this part. Besides providing information in these visualizations, VR provides a more elaborated experience of the intervention. This can lead to more motivation on change of behavior as it also provides more opportunities and capability to explore possibilities.
The aim of this study is to contribute to the integration of climate resilience in urban areas by creating motivation for individuals. VR can fulfill a considerable part in design for behavior change and possibly for solving the problems that come with the current and future climate changes. The purpose is to acquire a conclusion on whether an immersive virtual reality experience can stimulate participants to climate resilience action in the urban environment.
Related Works
Our paper builds upon knowledge and research from diverse fields. The foundation for our experience is the ongoing research into climate resilience solutions, nature based solutions and the measurable impacts these solutions have on livability, climate resilience, biodiversity and their investment- and maintenance costs. Additionally, we take inspiration from the field of using immersive technologies for behaviour change, changing attitudes and increasing engagement.
Climate resilience solutions
A growing interest has emerged in the climate-science research in the last years. On the one hand, this has provided a lot of answers and conclusions on the change of weather and climate. As a result, frequency and intensity of extreme weather events are predicted [16]. These extreme events can harm societies with continuing damage. For example, in October 2011, a flood hit Bangkok, which is a worldwide supplier of vehicle components and computer. This caused multiple factories all over the world to close. These systems are critical to urban function [12].
An important reason why climate action is not implemented yet, are the cost of the solutions, being unaware of possible solutions and bad media attention [8]. To combat this, it is important to encourage cultural dialogues and focus on actions that are still possible in local and specific context [8]. To increase accountability and therefor motivation to adapt, it is important to apply the solution to a local area or municipality, as this increases engagement [18]. Climate doomism, meaning the narrative that there is nothing to be done about climate change, is just as dangerous as not knowing or denial [14]. This means it is important to increase knowledge and motivation, without creating a doom scenario as motivation.
Virtual reality for engagement
Different research papers go into the idea of using virtual reality to reach a specific audience to care more for a certain topic. Virtual reality is an effective tool to increase knowledge and increase interest in the topic it is used for [15, 21]. Virtual reality, especially in combination with a digital twin, can support decision-making and motivation to participate in local public space planning [3]. Thereby, the interactive experience achieves engagement in deeper cognitive processing for the participants, who also rate their experience more positively when interaction is implemented. [24, 29]. Efficacy of immersive Virtual Reality as an educational medium on climate change has been found in a study in 2018, as it turns out to positively contribute to the process of learning, recalling and retain effects and causes [15].
VR Resilience Planner
VR Interface and interaction model
In order to not invalidate results on the effectiveness of using VR by it being the participant’s first experience with the technology, in a study on immersive field trips for learning about climate change [15], researchers expose participants to VR a week before performing the user study. Because of this attention to the novelty of VR to participants potentially being an influence on the validity of our findings, we have made creating an intuitive and seamless in-teraction model priority. This, to make sure poor usability and a steep learning curve does not get intertwined with the usefulnessand impact of the experience itself. We do not aim to research the effectiveness and usability of VR itself, rather the application of increasing engagement in individual climate resilience action. We argue that this is crucial in researching the potential benefits of spe-cific applications of virtual reality and other immersive technologies such as augmented- and mixed reality. We design our experience by taking into consideration the usability of our experience in 5 dimensions, identified by Nielsen [30] and further contextualised for virtual reality and virtual environments (VE) by Mousavi et al.[19];(1) learnability, (2) efficiency, (3) memorability, (4) low error rate and (5) satisfaction.
Controller-Action mapping: The controllers we use in the user study closely resemble traditional game controllers with for each hand a trigger, a grip button, primary and secondary buttons, a menu button and thumbstick. However, because our target group is not selected on having experience with VR, nor with playing video games, this amount of inputs would increase the time required to learn the interface. Therefore, we have chosen to merge the function of the trigger, grip button, primary and secondary button into one action. For the controller held in the dominant hand by the user, this is the select action. For the controller held in the non-dominant hand, this is the toggle menu action.
Pointing and clicking in VR: We use inspiration from the traditional 2D computer interaction paradigm of moving a cursor (pointing) and clicking (selecting). The only difference being that pointing now happens in 3D space. The cursor (referred to as reticle in Unity’s XR Interaction Toolkit [27]), gets raycasted from the tip of the controller into the world and user interface elements as sliders and buttons.
Switching handedness: With the user having to point and place objects in the 3D environment, common practice in VR de-sign applications, such as Gravity Sketch [9], Tilt Brush [25] and ShapesXR [23] is to include an option for handedness – whether the user is left handed or right handed. We predict this results in more efficiency and therefore this is included in the prototype.
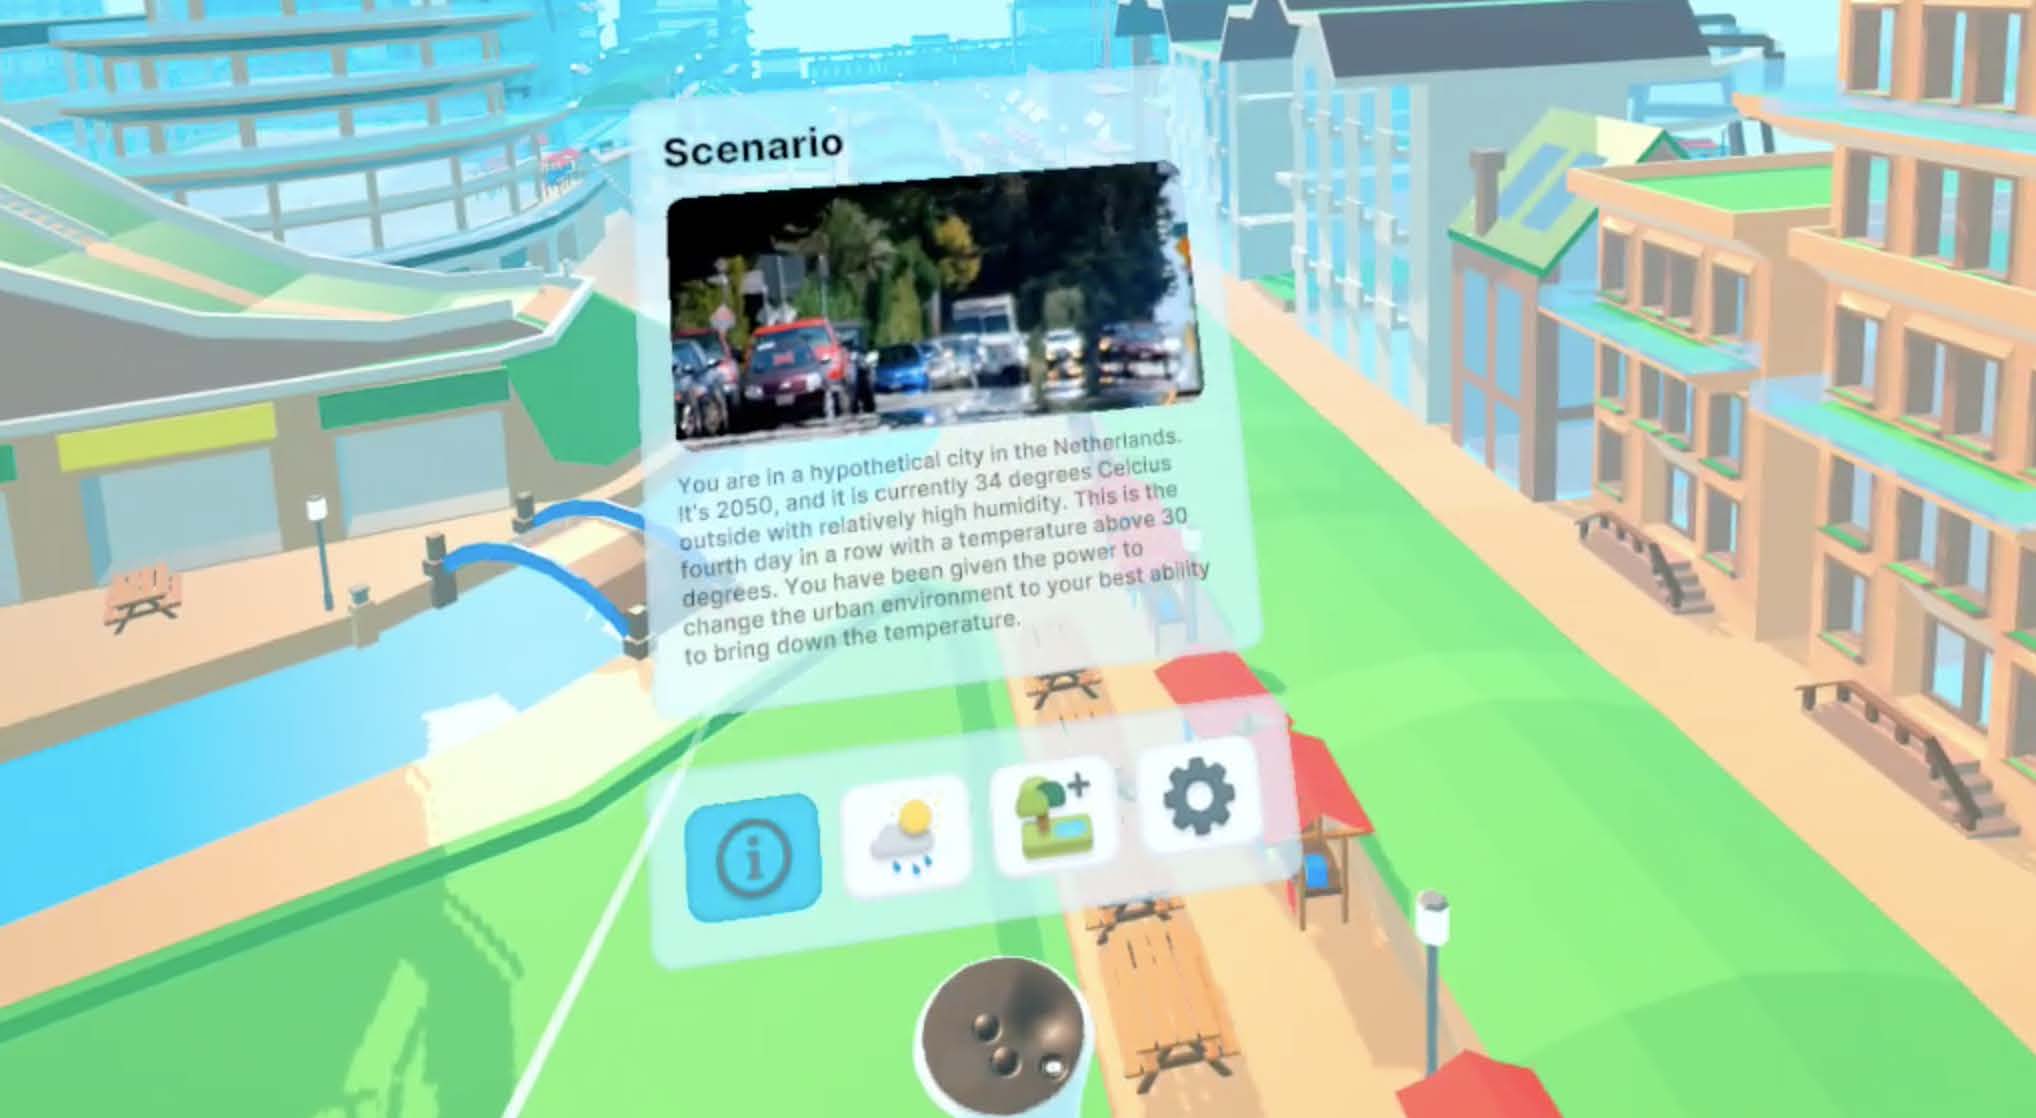
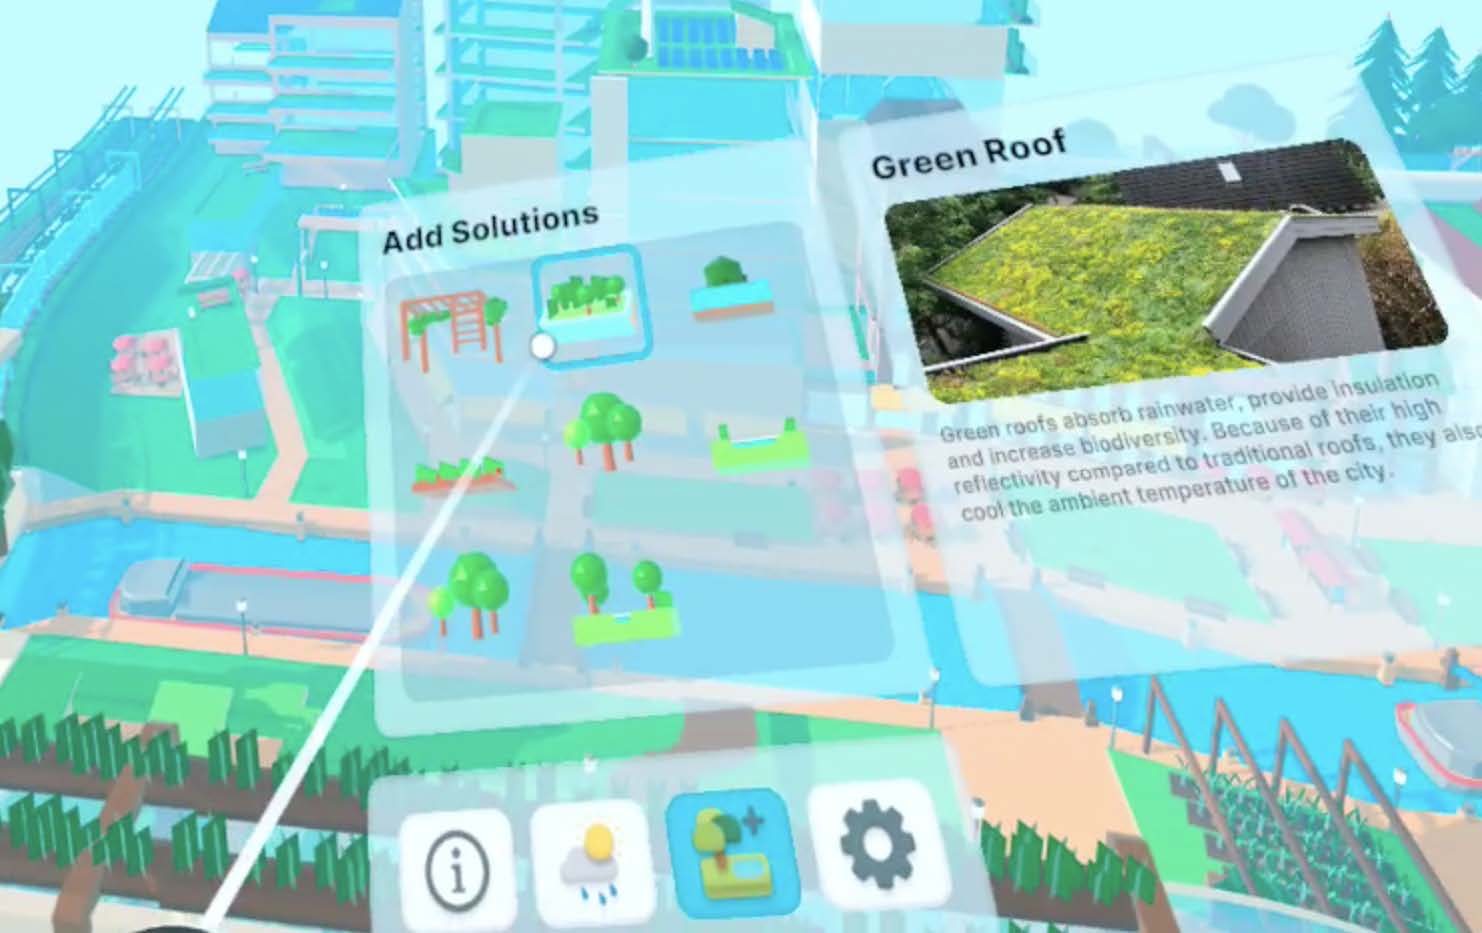
Menu and panels: In order to reduce information overload in the amount of options, we opt for the use of four tabs indicated with icons – a ubiquitous interaction paradigm in smartphone interfaces. By selecting, it opens a single panel that contains user interface elements. The following menu panels are included: (1) Introduction / scenario panel, (2) Weather simulation panel, (3) Add solutions panel, (4) Settings panel. When selecting
Locomotion
In designing a virtual reality (VR) experience, one of the important challenges is locomotion. This refers to the method with which the user moves around in the 3D virtual environment. Boletsis identifies four different methods for VR locomotion; motion-based, room scale-based, controller-based and teleportation-based [4]. In the prototype, we opt for controller-based locomotion. This, because the user needs to traverse a large environment – a world-scale city – and needs to switch between an overview perspective for adding solutions and a ground-level perspective for experiencing the aesthetics of the solutions. For this, the controller in the user’s dominant hand is used, with the orientation of the controller de-termining the direction the user moves in. Because no gravity gets applied to the user’s virtual character, the user can “fly around” freely in the virtual environment. The speed with which the user moves is determined by the fly speed slider in the settings panel. The speed ranges from slow (±1m/s) to fast (±20m/s).
The virtual environment - A fictitious Dutch city in 2050
For the environment the user traverses through and adds climate resilience solutions to, we opted for a fictitious city to reduce familiarity with existing infrastructure, allowing participants to focus on the benefits, rather than their predispositions and practical concerns their own living environment. Cost is left out of the experience for this same reason. The city is built on the idea of the Solarpunk movement. An art and aesthetic movement combining low-tech green solutions with high tech energy generation methods and standard of living [22]. This, with the goal to inspire participants towards an imagined future, an ideal that is beyond what is possible or feasible with current city planning practice.
Placing climate resilience solutions
For placing solutions, the user can hover over a solution that is present in the Add Solutions panel. This is done with the afore-mentioned pointing action. While hovering, a description panel gets populated with information about that specific solution. The solution can be dragged into the scene by selecting while hovering over a certain solution. While holding the select button – while selecting – the user can drag the solution into the 3D scene, as can be seen in figure 3 and figure 4. Solutions can be added to predeter-mined locations (slots). These slots get highlighted when dragging the solution into the scene. When the user points towards this slot with the solution selected, it will show a preview of the solution at that location. When the user stops selecting, the solution gets placed in this slot. An indicator for the temperature change this solution fosters is also included.
Weather simulation
The simulation of the weather in this prototype is implemented in a simplified way. Due to time limitations in the creation of the prototype and priority being in the holistic experience, simulation of the temperature is now based on a simple sum formula. Each solution contributes a certain amount of temperature impact to the total ambient temperature of the city. See the third image for a visual on how this temperature impact of an individual solution gets communicated towards the user. See the fourth image for the communication of the total ambient temperature in the city. We base the amount with which the temperature decreases on existing research on the effectiveness of climate resilience solutions such as green roofs, waterways, the addition of trees to the environment and green coverage to buildings.
Technical Implementations
The prototype is made with Unity [6, 10, 11], a cross platform 3D game engine with excellent support for developing interactive experiences for virtual reality capable devices. The code is built upon modern and open development standards, such as OpenXR [5]. We do not use the Oculus Interaction package. The interaction model is built on top of XR Interaction Toolkit [27], an open-source cross platform XR interaction package that helps speed up XR development. The source code for the prototype is available on GitHub.
Methods
For the method of testing our hypothesis and evaluating the usability and effectiveness of our prototype for its intended purpose – motivating and engaging people to taking action for climate resilience solutions – we employ both quantitative and qualitative data collection and analysis methods. These will be described hereafter.
Participants
5 participants were chosen using convenience sampling, with an age range of 20-33. (n=5). 40% (2 out of 5) of the participants lived in a rented apartment, and had therefor little impact on the climate adaption in their home. 60% (3 out of 5) of the participants live in a bought house or apartment, 66,7% (2 out of 5) of which share the bought house or apartment. Most of the participants (3 out of 5) try to live sustainably (6 or more on a Likert-scale of 1-7) and all of the participants want to learn more different climate solutions (5 or more on a Likert-scale of 1-7). The participants living in a bought house or apartment (3 out of 5) felt that their personal choices had little considerable impact on the climate (2 or lower on a Likert-scale of 1-7), while the people living in a rented house or apartment felt like their personal choices have considerable impact on the climate (5 or more on Likert-scale of 1-7).
Procedure
Participants were informed about the study setup and the collected data and were asked to fill in a consent form. Hereafter, observa-tional notes are made and what the participant says is recorded using live transcription.
Participants were asked to fill in a questionnaire with questions based on several theories. First general information was collected about their initial stance towards climate adaption, and their living situation. Additionally, the questionnaire contains 5 Likert-scale questions about the motivation to implement climate action and their perceived personal impact on climate change.
Then, the participant was given the choice whether to stand or to sit on a swivel chair, and given the virtual reality headset and the controllers were handed out to them.
During the VR experience, researchers answer usability questions regarding the prototype to help out the participant if they get stuck. Participants were not specifically instructed to communicate their thoughts during the experience.
After using the prototype, the participants were asked to continue with the questionnaire. Several Likert-scale questions about the experience with the prototype were asked and the 5 questions asked before the prototype were repeated to compare how the prototype impacted their motivation. Finally, the questionnaire had several sentence completion questions to allow the participant to give a more accurate vision of their opinion.
Afterwards, participants were asked to share their concerns with the prototype verbally, their stance on the impact it has on their stance towards climate resilience solutions.
Data Collection
Quantitative data analysis
Quantitative data collection from data streams of the virtual
reality prototype: Data collected from the prototype includes three different data streams, stored on the headset itself, thereafter re-trieved and stored on a secure medium. All entries in these data streams are timestamped.
- the position, headset orientation and current object that is being looked at by the user, at a sampling interval of 1 second.
- actions that are done at a singular point in time: (1) hover over solution in Add Solutions Panel, (2) exit hover over solution in Add Solutions Panel, (3) start placing solution, (4) stop placing solution, (5) start hover over solution slot in 3D space, (6) stop hover over solution slot in 3D space, (7) place solution in solution slot in 3D space, (8) set handedness, (9) open menu, (10) close menu, (11) select Add Solutions tab,
(12) select Weather simulation tab, (13) select Introduction tab, (14) select Settings tab. - Weather simulation, each time a solution gets placed, the simulation of the adjusted temperature gets logged.
Quantitative data collection from the questionnaire: Next to this, quantitative data was collected from the questionnaire in the form of Likert-scales from 1-7, about general stance towards climate adaption, motivation to improve local climate adaption before and after using the prototype and questions about the experience with the prototype.
Quantitative data analysis: From the quantitative data from the prototype, the time between adding solutions was measured, and for every participant an analysis was made on how many solutions were added in what time span, how long adding solutions took on average and the achieved temperature reduction. Next to this, an analysis was made on each solution and how often it was implemented, and how long it took to find. From the questionnaire, the quantitative data of the Likert-scales before and after using the prototype were compared, to see the impact of the prototype, as well as an analysis on the experience with the prototype.
Qualitative data analysis
Qualitative data is collected in the form of observational notes, and discussions that have resulted from the VR experience. Additionally, a set of pre-determined open questions are also present in the questionnaire [2]. For the qualitative data analysis we employ thematic analysis to extract data and aggregate data from the qualitative answers of the questionnaire and the observational notes, remarks from participants during and after study. We also use the coding phases from grounded theory [7]. We use inductive coding because of the open-endedness of the observational notes and answers in the questionnaire. The first step being initial coding, where we collect all transcriptions and answers and apply codes to the excerpts to label them. After this initial coding phase, we use axial coding to identify potential connections between the different codes. The categories that follow out of this coding phase are then used in se-lective coding, where the different categories get connected where the interconnectedness of categories is explored.
Findings
Quantitative & qualitative data
Findings from quantitative data: In the questionnaire, most participants (4 out of 5) thought the prototype was clearly structured (5 or higher on a Likert-scale of 1-7). From the questionnaire, the conclusion can be drawn that the prototype was not successful in increasing motivation or interest in climate action (see appendix F for full analysis), but this does not match the conclusion from the qualitative data. Therefore, the conclusion can be drawn that the questions in the questionnaire were not representative to reality and can be discarded.
Findings from qualitative data: Following the method described in the previous section on qualita-tive data analysis, we perform initial coding, where excerpts from the observational notes and questionnaire answers are supplied with codes. These codes are specific and do not necessarily repeat. For example, “Oh this is so cool, this user study is going to take longer than twenty minutes”, becomes “participant is impressed by visualisation and interaction in VR”.
After this phase of initial coding, we perform axial coding, where each code is generalised into a specific category or theme. The recurring themes we have identified from the initial codes are as follows:
- Accuracy and complexity of the weather and impact simulation
- Freedom in testing different solutions
- Fidelity of the 3D environment and impact simulation
- Effectiveness of the interaction model of placing solutions
- Usability of the menu interface
- Accessibility and effectiveness of locomotion system
- Impact on people’s knowledge and interest in climate re-silience solutions
- Impact on people’s direct actions after the VR prototype
- Engagement with the experience and virtual environment
After this phase, following aforementioned grounded theory methods, we perform selective coding, where we explore the in-terconnectedness and hierarchy of these categories. From this, we identify the following main categories or themes and hierarchy of the themes falling under these:
(1) Findings on the experience
(a) Freedom in testing different solutions
(b) Accuracy and complexity of the weather and impact sim-ulation
(c) Fidelity of the 3D environment and impact simulation
(d) Engagement with the experience and virtual environment
(2) Findings on the VR interface and interaction model
(a) Usability of the menu interface
(b) Accessibility and effectiveness of locomotion system
(c) Effectiveness of the interaction model of placing solutions
(3) Findings on the impact of the use of the VR prototype on climate resilience action in participants
(a) Impact on people’s knowledge and interest in climate re-silience solutions
(b) Impact on people’s direct actions after the VR prototype
In the following part of this section, the insights in these different themes are shared, with reference to comments and observational notes from the user studies.
Findings on the impact of the use of the VR prototype on climate resilience action in participants
This section of findings will go into the impact the use of the VR prototype has had on participants and their immediate actions after having experienced the VR prototype. While we are not able to say anything about the long term change in behaviour, attitude and engagement towards climate resilience action of participants because of our prototype, we are able to state certain potentially positive findings based on observational notes and topics mentioned by participants.
From analysing our data, we see that participants did act on the presented climate resilience solutions and their impact on tempera-ture in the experience (3/5). After experiencing the VR prototype, one participant sent a text message to their family group chat saying that they would want to add vines to their balcony (P4). Another participant mentioned how they would potentially add more plants to their balcony (P2), as well as mentioning how not green the buildings of the Eindhoven University of Technology (TU/e) were. P2 also mentioned “Look into guerilla gardening. That could be something for you. Maybe we should create a guerilla gar-dening movement for TU/e students. Why is there no green roof over there on Metaforum? Also wasn’t there a certain city that painted their streets white to combat heat?”. This formation of a discussion after the experience happened with participants (3/5), without the researchers directly actively prompting questions. Another partici-pant (P3) mentioned how they would look into making their garden more climate resilient by adding more greenery.
While these instances of positive influence on motivation are singular due to our limited sample size, they show that doing more research into the positive influence such a virtual reality experience could have on motivating people to help make the city greener, might be worthwile for future research.
Findings on the VR interface and interaction model
The findings on the VR interface and interaction model refer not to the experience itself, but mainly to the way the user interacts with this experience, e.g. the way the user points, selects and drags a solution, instead of the concept of placing solutions in different slots.
Usability of the menu interface: The menu interface received no comments from participants and required no further explanation from researchers to be understood. Users quickly picked up the intended interaction and could easily follow instructions given by the researchers to open the different panels. This can also be cross-validated with the quantitative data from the data streams of the prototype, where the time between starting the prototype user test and opening the menu and selecting a panel, is consistently under 15 seconds across all participants. Throughout the user study, the panel gets used intensively with adding solutions and seeing the impact on ambient temperatures.
Accessibility and effectiveness of locomotion system: Before carrying out the user studies, our assumption was that the loco-motion system would be a major accessibility issue, however, from observational notes and feedback from the participants we see that this is not the case. Participants (4/5) do mention it having an ef-fect on their sense of stability and the feeling that it might induce motion sickness, however, this is not mentioned repeatedly. By setting the initial fly speed at the lowest setting by default, and automatically resetting this between user studies, participants get introduced to the idea of flying. This initial setting is not fast enough to traverse the entire virtual environment, so participants (5/5) ask the researchers how to increase the fly speed. After the researchers mention how to do this, and participants change the setting (mean of 10m/s), participants do report a feeling of uneasiness (3/5, e.g. “Putting the fly speed up is intense”, P3). At no point did a partici-pant stop the experience because they could not continue with the experience due to motion sickness. A selection of participants that were more uncomfortable with flying (3/5) accepted the offer of researchers to sit on a swivel chair, as can be seen in figure 6. On the other dimension, the effectiveness of the locomotion system of flying around, participants report it being fun, adding to the over-all experience of changing the city (“this is soo cool, I have always wanted to be able to fly”, P2). From this we can cautiously conclude that flying around in a city in virtual reality is a viable effective way of providing locomotion within a large scale city, potentially being useful for other virtual reality digital twin applications in the area of urban planning. With the requirement being that there needs to be a chair around and fly speed needs to be gradually increased.
Effectiveness of the interaction model of placing solutions: The interaction model for placing solutions in the environment is de-scribed in detail in the section on the VR prototype – VR Resilience Planner. This finding does not go into what has already been mentioned in the section “Freedom in testing different solutions”. This is specifically on the raycasting behaviour and sequence of pointing, hovering over UI element, selecting, dragging, hovering over spatial solution slot in the environment, releasing selection button. Some participants reported initial difficulty with placing solutions in the environment through this sequence of actions (2/5, e.g., “I think I am just incapable”, P4). However, after the initial phase, this sequence is not the bottle neck anymore in placing solutions. The most important issue with placing the solutions is the fact that it is hard to make out where the solutions can be placed. This is communicated through highlighting the spatial solution slots a solution can be placed in while dragging a solution around, but these highlights share the same color and transparent material with the buildings’ glass material (3/5, e.g., “It indeed took a bit of searching to find the solution slots, because the highlight color is blue, it’s hard to see the difference between fog, building and solutions slots”, P4). This resulted in confusion. Participants still wanted to completely fill the environment with all solutions (5/5, e.g., “No, now that I am this far, I want to complete everything”, P4). Additionally, participants use the scanning motion to find solutions as described in “Freedom in testing different solutions”.
Findings on the experience
The findings on the experience are the findings that are relevant not to how the user interacts with the experience, but rather the experience itself, such as the immersive environment and the design of the experience.
Freedom in testing different solutions: With communicating the effectiveness of climate resilience solutions taking center stage in the prototype, the simplistically designed experience detracted from participants being able to explore the potential of different solutions. In the current version of the prototype, it is only possible to add solutions to predetermined slots. This reduced a feeling of autonomy and engagement in the participants of our user study. (4/5, e.g. “Now I’m just checking all places to see if I can fill something up”, P2). This was also evident in participants exhibiting a scanning motion to see where to place the solution (3/5, e.g., “participant starts exhibiting some sort of scanning motion”, observational note by researcher). With being able to try out different solutions, par-ticipants mention how this would make them think more about the benefits of different climate resilience solutions in different places.(2/5, e.g., “The prototype could be more interactive by expanding the options and allowing more freedom of what things to place and what the pros and cons are of each solution”, P5)
Accuracy and complexity of the weather and impact simulation: The accuracy of the simulation is crude, with it being a sum of the individual temperature impacts of all solutions. This was a concern that is shared across participants. Participants report that in order to truly feel like the solutions would actually have the impact that is communicated to them through the prototype in real life, the simulation would need to be more advanced, or at least be based on an accurate model with scientific backing (3/5). We argue that this is the most important part of the experience, and the one that has the most influence on the amount of impact the prototype can have on climate resilience action by the participants after the experience. Participants also mention how they would be interested in seeing more variables being taken into account in the simulation, such as cost, running cost and (4/5, e.g., “Use different measures for how good or bad a climate resilience solution is, integrate different costs.”, P5).
Fidelity of the 3D environment and impact simulation: Participants report wanting to see the experience react more to the solutions they have added to the environment. (3/5, e.g., “I think the captivating aspect of this prototype is seeing the direct impact you can see that you have on the environment. Having people in the experience going to a park you build would be one way this could be done”, P1). With the 3D environment currently being a static environment, this could be improved upon, and we argue that improving in this aspect could be an interesting future step to research into. To see how much the fidelity of the 3D environment and simulation of impact in the form of a reactive environment with simulated people would influence the amount of engagement people have with the prototype, and how that in turn affects the end result of people being more interested in climate resilience action.
Engagement with the experience and virtual environment: Participants mention how the virtual environment is interesting to them (4/5, e.g. “It was fun to walk through the city, really interesting.”, P3). We see this also by the fact that participants do not stop the experience before they are finished placing almost all solutions in a mean time of ±15 minutes.
Discussion
An important limitation of our study is the small sample size (n=5) of our study, while qualitative data analysis allows us to get more detailed data, as found in the findings section, having a larger sam-ple size will increase the ability to use statistics for the significance of certain findings. Next to this, with virtual reality still being a relatively new technology, not all participants were familiar with the technology, potentially hindering results in the usability of the VR interface.
Another limitation of our study is the accuracy of the weather simulation, as mentioned in our findings section. We argue that this – sound scientifically based research into the benefits of certain solutions – is the most crucial part of convincing people of the true benefits of these climate resilience solutions. Additionally, in order to truly convince people of the benefits of these solutions, more variables need to be taken into account in the simulation and should be efficiently communicated to the user. Such variables could include the upfront cost, running cost, but also other potential benefits such as biodiversity, material friendliness, amount of work required to maintain it and potential risk factors. We argue that for future research, creating a simulation that takes into account these variables might see more impact on a change in motivation for climate resilience solutions.
The actionability of the suggestions that are present in the experience is also relatively low, because it is focused on a large scale environment, which participants mentioned was hard to translate to what they can do themselves. In combination with certain par-ticipants mentioning not trusting local politicians with following through with adding more green to the city, future research could look into a smaller scale, maybe neighbourhood scale or even house scale, climate resilience solutions and corresponding simulation.
In future research, motivation should be defined more clearly. This allows for a more controlled study where we measure one variable. One such interpretation of motivation could be whether someone signs up for a workshop, or the amount of plants and trees a participant adds in their garden after experiencing the prototype.
Helplessness and hopelessness in climate action are topics that should be looked into further for future research, since certain participants share the concern that while the presented climate resilience solutions would be beneficial to the city, politicians are again a bottleneck.
Conclusion
Our study was aimed on the stimulation of implementing more solutions on climate resilience in privately owned urban areas. By conducting studies and gather data with questionnaires, the study can conclude several results from the experiences that participants had with the climate resilience prototype. We see that VR can play a role in motivating people, however, what is done in the VR experience takes precedent over the fact that it is virtual reality. More research should be done into different methodologies. Also, to really achieve change of attitude with this prototype, the communicated data of solutions should be more accurate. Our VR Prototype was sophisticated enough to conduct usable research with VR, but the simulation itself was crude. We have open sourced the code to be used by researchers for VR research using the latest programming standards. We see that VR could be used in combination with traditional methods of communicating information, such as written text, or a teacher. VR can make the given information live more, but having it in isolation. The experience of users with the VR prototype did not stimulate or motivate them enough to draw con-clusions based on this study, but the communication of information benefited from the use of VR. Users gained more knowledge on the topic and possibilities to implement climate resilience solutions in their private urban areas.
References
[1] P. Alpert, T. Ben-Gai, A. Baharad, Y. Benjamini, D. Yekutieli, M. Colacino, L. Diodato, C. Ramis, V. Homar, R. Romero, S. Michaelides, and A. Manes. 2002. The paradoxical increase of Mediterranean extreme daily rainfall in spite of decrease in total values. Geophysical Research Letters 29, 11 (6 2002), 31–1. https://doi.org/10.1029/2001GL013554
[2] Claire Anderson. 2010. Presenting and Evaluating Qualitative Research. American Journal of Pharmaceutical Education 74, 8 (10 2010). https://doi.org/10.5688/AJ7408141
[3] Paola Di Biagi, Sara Basso, Alessandra Marin, and Giorgio Caprari. 2022. Digital Twin for Urban Planning in the Green Deal Era: A State of the Art and Future Perspectives. Sustainability 2022, Vol. 14, Page 6263 14, 10 (5 2022), 6263. https://doi.org/10.3390/SU14106263
[4] Costas Boletsis. 2017. The New Era of Virtual Reality Locomotion: A Sys-tematic Literature Review of Techniques and a Proposed Typology. Mul-timodal Technologies and Interaction 2017, Vol. 1, Page 24 1, 4 (9 2017), 24. https://doi.org/10.3390/MTI1040024
[5] Matthew S. Brennesholtz. 2018. 3-1: Invited Paper: VR Standards and Guidelines. SID Symposium Digest of Technical Papers 49, 1 (5 2018), 1–4. https://doi.org/10.1002/SDTP.12476
[6] Jack Brookes, Matthew Warburton, Mshari Alghadier, Mark Mon-Williams, and Faisal Mushtaq. 2020. Studying human behavior with virtual reality: The Unity Experiment Framework. Behavior Research Methods 52, 2 (4 2020), 455–463. https://doi.org/10.3758/S13428-019-01242-0/FIGURES/7
[7] Juliet Corbin and Anselm Strauss. 1990. Grounded Theory Research: Procedures, Canons, and Evaluative Criteria. Qualitative Sociology 13 (1990).
[8] Aleksandra Dulic, Jeannette Angel, and Stephen Sheppard. 2016. Designing futures: Inquiry in climate change communication. Futures 81 (8 2016), 54–67. https://doi.org/10.1016/j.futures.2016.01.004
[9] Gravity Sketch. 2022. Gravity Sketch | 3D design and modelling software. https://www.gravitysketch.com/
[10] Jason Jerald, Peter Giokaris, Danny Woodall, Arno Hartbolt, Anish Chandak, and Sebastien Kuntz. 2014. Developing virtual reality applications with Unity. (5 2014), 1–3. https://doi.org/10.1109/VR.2014.6802117
[11] Sung Lae Kim, Hae Jung Suk, Jeong Hwa Kang, Jun Mo Jung, Teemu H. Laine, and Joonas Westlin. 2014. Using Unity 3D to facilitate mobile augmented reality game development. 2014 IEEE World Forum on Internet of Things, WF-IoT 2014 (2014), 21–26. https://doi.org/10.1109/WF-IOT.2014.6803110
[12] Richard G Little. 2002. Controlling Cascading Failure: Understanding the Vul-nerabilities of Interconnected Infrastructures. Journal of Urban Technology 9, 1 (2002), 109–123. https://doi.org/10.1080/106307302317379855
[13] Haimeng Liu, Chuanglin Fang, Yi Miao, Haitao Ma, Qiang Zhang, and Qiang Zhou. 2018. Spatio-temporal evolution of population and urbanization in the countries along the Belt and Road 1950–2050. Journal of Geographical Sciences 28, 7 (7 2018), 919–936. https://doi.org/10.1007/s11442-018-1513-x
[14] Michael E. Mann. 2021. The new climate war : the fight to take back the planet. PublicAffairs.
[15] David M Markowitz, Rob Laha, Brian P Perone, Roy D Pea, and Jeremy N Bailen-son. 2018. Immersive Virtual Reality Field Trips Facilitate Learning About Climate Change. Frontiers in Psychology 9 (2018). https://www.frontiersin.org/article/10.3389/fpsyg.2018.02364
[16] McMichael, A. J. (2015). Extreme weather events and infectious disease outbreaks. https://doi.org/10.4161/21505594.2014.975022
[17] Gerald A. Meehl and Claudia Tebaldi. 2004. More intense, more frequent, and longer lasting heat waves in the 21st century. Science 305, 5686 (8 2004), 994–997. https://doi.org/10.1126/SCIENCE.1098704/SUPPL{_}FILE/MEEHL.SOM.PDF
[18] Susanne C Moser and Julia A Ekstrom. 2011. Taking ownership of climate change: participatory adaptation planning in two local case studies from California. Journal of Environmental Studies and Sciences 1, 1 (3 2011), 63–74. https://doi.org/10.1007/s13412-011-0012-5
[19] Maryam Mousavi, Yap Hwa Jen, and Siti Nurmaya Binti Musa. 2013. A Review on Cybersickness and Usability in Virtual Environments. Advanced Engineering Forum 10 (12 2013), 34–39. https://doi.org/10.4028/WWW.SCIENTIFIC.NET/AEF.10.34
[20] Jakob Nielsen. [n. d.]. FINDING USABILITY PROBLEMS THROUGH HEURISTIC EVALUATION. Proceedings of the SIGCHI conference on Human factors in computing systems – CHI ’92 ([n. d.]). https://doi.org/10.1145/142750
[21] A Nikolaou, A Schwabe, and H Boomgaarden. 2022. Changing social atti-tudes with virtual reality: a systematic review and meta-analysis. Annals of the International Communication Association 46, 1 (1 2022), 30–61. https://doi.org/10.1080/23808985.2022.2064324
[22] Reina Rozo and Juan David. 2021. Art, Energy and Technology: the Solarpunk Movement. International Journal of Engineering, Social Justice, and Peace 8, 1 (3 2021), 47–60. https://doi.org/10.24908/ijesjp.v8i1.14292
[23] ShapesXR. 2022. ShapesXR—VR Creation and Collaboration Platform for Re-mote Teams. https://www.shapesxr.com/
[24] Maria Sicilia, Salvador Ruiz, and Jose L Munuera. 2005. EFFECTS OF INTERAC-TIVITY IN A WEB SITE: The Moderating Effect of Need for Cognition. Journal of Advertising 34, 3 (2005), 31–44. https://doi.org/10.1080/00913367.2005.10639202
[25] Simon So, Simon So, and Emma Lu. 2019. Virtual Reality in Visual Arts Education: A Study on Using Google Tilt Brush. EdMedia + Innovate Learning 2019, 1 (2019), 1485–1490.
[26] Cascade Tuholske, Kelly Caylor, Chris Funk, Andrew Verdin, Stuart Sweeney, Kathryn Grace, Pete Peterson, and Tom Evans. 2021. Global urban population exposure to extreme heat. Proceedings of the National Academy of Sciences of the United States of America 118, 41 (10 2021). https://doi.org/10.1073/PNAS.2024792118/-/DCSUPPLEMENTAL
[27] Unity. 2022. XR Interaction Toolkit | XR Interaction Toolkit | 2.0.2. https://docs.unity3d.com/Packages/com.unity.xr.interaction.toolkit@2.0/manual/index.html
[28] T J Wilbanks, P Romero Lankao, M Bao, F G H Berkhout, S Cairncross, J P Ceron, M Kapshe, R Muir-Wood, and R Zapata-Marti. 2007. Industry, settlement and society. In Climate Change 2007: Impacts, Adaptation and Vulnerability, Contribution of Working Group II to the Fourth Assessment Report of the Intergovernmental Panel on Climate Change, M L Perry, O F Canziana, J P Palutikof, J P van der Linden, and C E Hanson (Eds.). Cambridge University Press, Cambridge, UK, 357–390.
[29] Qian Xu and S. Shyam Sundar. 2016. Interactivity and memory: Information processing of interactive versus non-interactive content. Computers in Human Behavior 63 (10 2016), 620–629. https://doi.org/10.1016/J.CHB.2016.05.046