
Project 2: Prospect
Squad: New Futures


Introduction
The prevailing high-carbon economy and society as we know it is undoubtedly undergoing a fundamental energy transition. A post-carbon, post-peak-oil scenario is bound to challenge individuals and nations on a global scale within the upcoming decades [1]. However, the future of energy is uncertain, as the current conditions can lead to multiple plausible futures [2]. A rather obvious implication of this development is that a behavioural change must take place, underlining the importance of adaptivity in all sectors of life. The New Futures project squad acknowledges this challenge, and aims to design for preferred futures, in the context of a smart home in the year 2035.
In this project, we (Anton Tuomaala, Emiel Muter, Maud van der Linden and me) aimed at creating a physical interface that allows to plan for energy uncertainty and net-neutrality, which would encourage a change in behaviour in their energy consumption. To that end, we created Prospect, an interface the size of a wall where a family can come together to plan their energy usage for the day, week or month. It acts as a tangible platform for communicating with IoT devices in the home.
Scenario assumptions
To concretize the scenario, we decided on some assumptions about the 2035 future. We assume that novel technologies will be available to store energy on short- and long terms, and local production of energy will also be more widespread. Assuming more reliance on PV-based energy production, we also assumed there would be more need for self-sufficiency or net-neutrality, as this would combat the net-congestion. Finally, we assume new technologies to support IoT and growing systems.
Theoretical Backdrop
This chapter provides an insight into different aspects of the future scenario which the design project is built on. Rather than diving into explanations on process steps, it answers questions such as what the world is like, and how energy is being used in 2035. Furthermore, it will explain how these conditions will affect the life of a family within a smart home. Lastly, the chapter presents a brief overview of supporting literature concerning the topic.
The design space
In order to design for a specific future, and a specific context, the team has illustrated a future outlook that serves as a support for major design decisions taken during the project. As mentioned earlier, the energy future is highly uncertain, and while some predictions might be more plausible than others, there is no definitive answer to how the household energy consumption will be like in 10-15 years. The team decided to use a futuring method called scenario planning as an aid. Here, the general aim is to create four divergent but probable future scenarios on a 2-dimensional axis system [2]. The two separate axes represent independent driving forces that have an impact on societal (energy) trends. As an example, two axes used early in the process were “density/efficiency of dwelling space (high to low)” and “political will for climate actions (high to low)”, that provided valuable initial insights.
The exploration exercises have led to one leading conclusion about future energy resources: availability of energy will be intermittent, partially due to the production characteristics of renewable energy. When shifting away from fossil energy forms and national grids, the stability and consistency they used to provide is changing form. Before this long-term prediction takes place, the society of 2035 requires means to prepare for fluctuating energy availability
in near future. Communities will encourage each other towards self-sufficiency, while the use of grid energy is more costly, environmentally less sustainable, and consequently socially less acceptable. The majority of energy production will be coordinated by local communities and individual households. In order to minimise the reliance on the main grid, consumption of energy should generally coincide with production peaks. The most optimal way of benefiting from renewable energy is to consume it when it is widely available, minimising the need for short-term storage and losses in the local circuit. This being said, long term storage will play an important role, as it is necessitated by considerably lower energy production in the winter months (in the Netherlands). Recent technological developments suggest that this is feasible [3]. Consequently, any surplus energy will be stored in community/household battery units to ensure access to energy during less favourable seasons and weather conditions.
The project description for New Futures makes use of a fictional family, consisting of mundane characters, living in an imaginary house in the Netherlands. Considering the prevailing scenario, the Zander family will be expected to adapt. In practice, adaptation will mean that energy consumption is being rationed on a continuous basis by means of smart planning. Appropriate planning of energy consumption will in turn allow activities to be conducted in the most favourable conditions, i.e., when momentary energy production allows the net energy flow be positive or near-zero. Successful planning, as well as rationing, requires the Zander family to be well aware of their consumption habits. The household should thus reflect on their performance, in order to improve it. In an Ideal case, the family would be capable to reflect on past behaviour, as well as predict their future needs.
End Product
The final product was created after two design phases, feedback and user tests. It is described below. A version of this was also submitted to the Design Intelligence Award selection round.
Function
The main goal of the wall interface is to provide its users with a tool that provides insights into their energy-consuming behaviour as well as patterns in habits. This will gain importance in a time when behaviour has to be flexible and adaptable due to intermittent availability in energy resources. The wall shows the user not only the predicted availability and thus the best moments to consume energy, but also provides a platform for planning on a 7-day time scale. Here, the users are free to use the wall as a sandbox for experimenting with variations in their routines, where the emphasis is on selected activities that the household needs to perform on a regular basis. The wall provides direct and dynamic feedback on the consequences that these planned activities have on their energy consumption and energy reserves.
The system communicates information on three different time scales. In a top-down order, these are: a 48-hour timeline, a 14-day timeline, and a 12-month timeline. Each timeline is a combination of a continuous ‘wave’ graph (net electricity production), and a linear protruding/retracting visual (performance indicator).
The performance measure is important to include when looking at the circumstances the different seasons provide: in the summer production will be far greater than in the winter and consumption habits are different for each season, so just providing insight in energy consumption and production is insufficient without context on what is normal for that time of year, which is the purpose of the performance measures. The daily time scale offers more actual real-time
information to the users which can make the difference in opting to go e.g. for a cold shower rather than a hot one, if the user deems it necessary. The yearly time scale gives the users more perspective in how their choices influence the bigger picture and what energy availability awaits them in the long term. The weekly time scale provides a middle ground between the daily and the yearly: it provides information on a graspable time scale while also offering an insight into expected availability and past energy usage/production. As it is acknowledged that the learning curve of the system is steep, a user manual was created.
As pointed out by the user evaluations, the system was initially hard to understand, but once explained, was clear in the information it presented. The user manual is there to serve that purpose.
The key aspect of the design is that it does not make decisions for the users: it provides the platform and tools to plan, experiment, see ahead and reflect on the past. Users can use this information to set their own goals and make their own decisions to reach these goals.
Interaction
Making trade-offs in our energy-consuming behaviour will become an essential part of everyday life, as it is necessary for adaption towards changing circumstances. Therefore the wall includes a tangible interaction segment where the users are able to plan their energy usage over the upcoming week for each day. The users can allocate different activities on the right-hand side of the horizontal time scale, as that represents the ‘future’, which is seven days ahead. The yearly, weekly, and daily net-graphs and performance-graphs will change according to the decisions a household makes while planning their energy consumption.
This interactive planning will have an impact on the three net-graphs. For instance, planning extra activities will increase the consumption which gives a lower net value. The planning also effects the performance graphs. Because the performance graphs are based on a deviation of the actual production-consumption from the expected ideal production-consumption, dependent on factors like seasonal changes, certain patterns of planning change over time. The interface expects people to use this interactive planning tool to adapt to different uncontrollable scenarios, guiding households towards self-sufficiency.
The left side of the planning is the actual data produced within the home, meaning that the amount and allocation of activities can be different from the initial planning. Users can reflect on how their energy-consuming behaviour constructed the net-graphs and performance graphs. For instance, they can choose to use specific planning routines again or recognize potential mistakes they made in the previous week during planning.
The overview of the past, the present, and the future together give the household a clear picture of aspects like the fluctuations in energy production, what activities/devices are used regularly and how energy-consuming routines progressed and can be improved.
The different activities are labelled with a label, which is made of a light shining through the (wooden) wall material. These labels are placed on the left-hand side of the wall, next to the planning controls. The activities are editable for the user. To plan an activity, the control of the preferred activity on the timeline is mechanically pushed. A simple spring mechanism in the control will then allow it to protrude out of the wall. The user is then able to adjust the intensity of the activity themselves, by pushing or pulling the control. The further out the activity is ‘pulled’, the more energy-consuming the activity will be (higher intensity, longer duration, higher frequency, depending on the activity type). This is useful in cases when the user knows in advance how much the activity will consume, for example when taking a cold shower instead of a regular warm shower.
Form
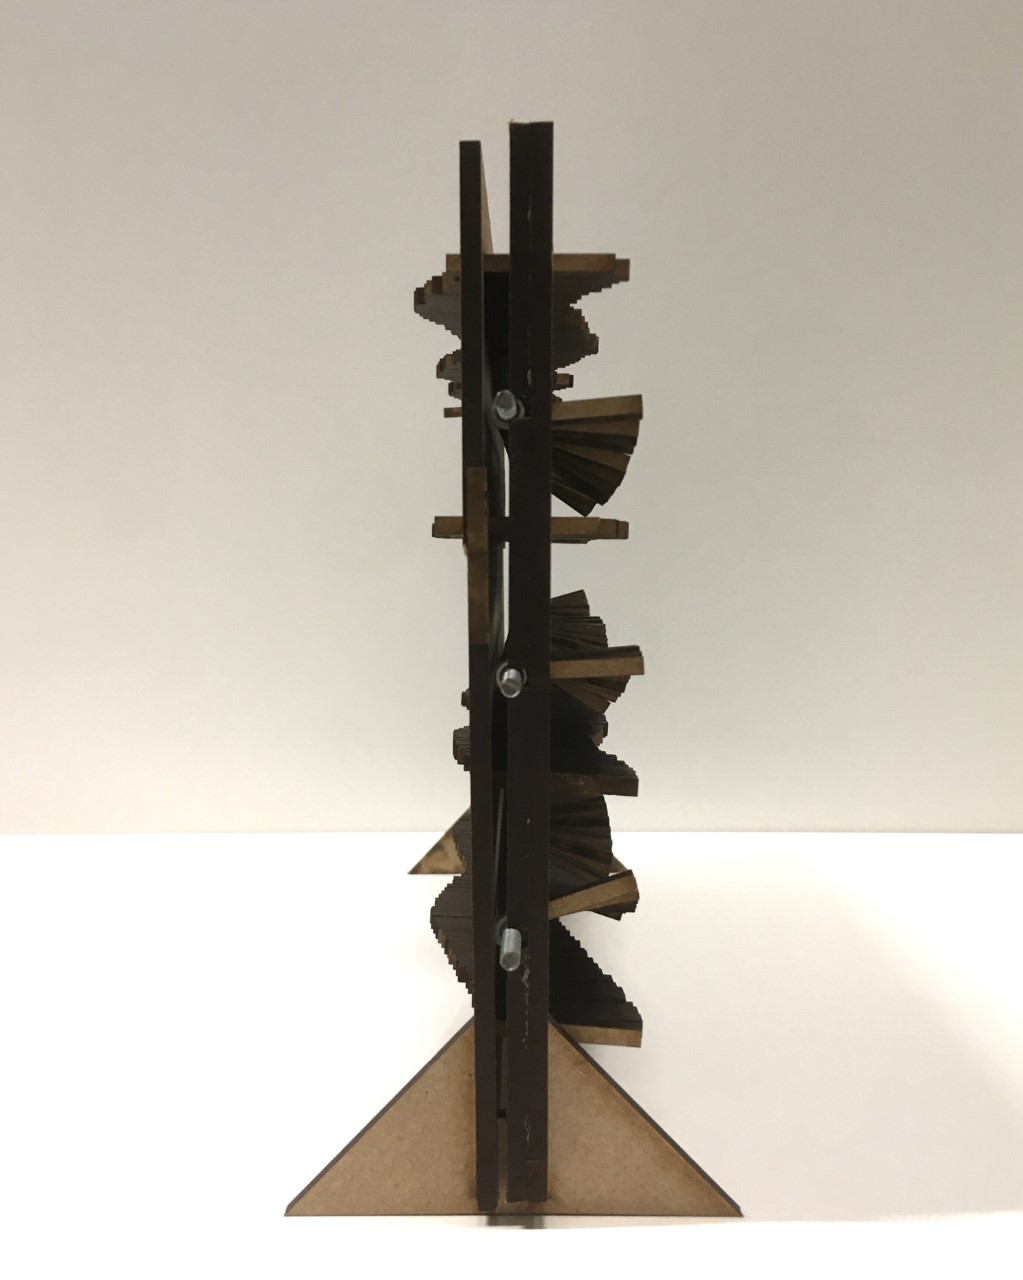
The main goal with the visual form language, from the early stages of the project, has been expression of meaningful information by means of repetitive, parametric shapes. Although in practice created manually, the appearance of the net-power graphs as well as performance indicators, bear strong similarities with computerised, parametric shape creation.
Besides the geometry, the graph layout of the final prototype follows closely the descriptions given in previous sections: the three different time-scales are all visualised by a net consumption graph and a performance measure. The planning section has been given a central location to serve as a focal point in the layout, also taking into account appropriate height for interaction with arms. A central dividing element clearly marks the location of the present-moment, forming another important visual focal point.
In horizontal direction the future prediction and planning is placed on the right side of the wall element, consequently the history of user’s actions is to be viewed on the left side. An optional visual feature, the shadow gradient, has been added to symbolise the movement of time, as well as the difference between present-moment and the past.
Although labelling has been discussed earlier in the report, these items have consciously been left out from the physical prototype. The reason for this is that in its current form, the interface retains the visual state as intended by the design team: intriguingly complex, subtle, even somewhat mysterious. The team wanted the wall to translate its expressivity fully through the medium of physical form language, not by augmented labelling. As elaborated before, labelling can be electronically visualised by the users if they so wish. Examples of them have been can be seen next to this section.


Future works
Intuitiveness
During user tests, most participants had difficulties understanding the functionalities of the concept without explanations. Therefore a manual was created as a support. Still, for future works it would be beneficial to improve the intuitiveness of interaction with the aesthetics. Therefore multiple physical prototype variations could be tested, as it might provide different results compared to the digital version. Besides, research could be done on labelling, to avoid confusion without compromising the abstract aesthetic.
Grouping devices
In the current iteration, five editable activities are included in task planning. These activities are changeable, based on the user’s preference. However, the number of activities and the activities themselves are fixed, while people might want to add activities or change/add elements within a certain activity or practice. The team thinks that people are not necessarily consuming energy to use devices but to perform certain routines that make sense to them. Therefore, in a future iteration it would be possible for households to make groupings with device cathegories or activities, to create routines rather than individual activities. These routines could for instance be divided on a room-wise basis (kitchen activities, living room activities, etc.).
In practice theory, behavioural change can be conceptualised as practice change because all human behaviour can be viewed as the performance of one or more practices [4]. Kuijer [4] explains that ‘practices change when new elements are introduced or when existing elements are combined in new ways’. In other words, when aiming to change a practice and eventually to change behaviour, one way to do so is to introduce new elements into them [4].
Users will be able to see how their current routines affect the energy future with the help of the interface. It motivates households to improve their routines over time, to learn how behaviour affects adaptation towards intermittent energy availability.
Take cooking as an example, in which multiple households have different routines. One might use various different devices, while another household uses a lot of electricity with just a few devices, or some cook more often than the average household. By adding elements or activities to practices, the routines defined are more detailed, making it easier to reflect. This makes it clearer to visualize which aspects contribute to preferable or unpreferable behaviour.
Modularity
As a final point, to increase the usability of the wall, graph sections could be made modular, i.e. to support the exchange of materials, colours, different sizes of controls. This could increase the product’s desirability on commercially, and personalisation increases emotional connection towards the interface, becoming more attractive to use.
References
- Anthony Elliott and John Urry. 2010. Mobile Lives. https://doi.org/10.4324/9780203887042
- Glenn Lyons and Cody Davidson. 2016. Guidance for transport planning and policymaking in the face of an uncertain future. Transportation Research Part A: Policy and Practice 88 (06 2016), 104–116. https://doi.org/10.1016/j.tra.2016.03.012
- Micah S. Ziegler and Jessika E. Trancik. 2021. Re-examining rates of lithium-ion battery technology improvement and cost decline. Energy Environ. Sci. 14 (2021), 1635–1651. Issue 4. https://doi.org/10.1039/D0EE02681F
- Lenneke Kuijer. 2017. Practices-oriented design. Design for Behaviour Change (2017), 116–127. https://doi.org/10.4324/9781315576602-10